U.S. Cancer Statistics: Highlights from 2020 Mortality and Incidence with Comparison to 2019 Incidence to Assess the Effect of the COVID-19 Pandemic
U.S. Cancer Statistics Data Briefs, No. 35
June 2023
The COVID-19 pandemic disrupted health services, leading to delays and reductions in cancer screening, diagnosis, and reporting to some central cancer registries. This may have contributed to an observed decline in 2020 incidence for most cancer sites.
Each year, the Centers for Disease Control and Prevention (CDC) and the National Cancer Institute (NCI) produce updated U.S. Cancer Statistics data. These data are the official federal cancer statistics for the United States. The U.S. Cancer Statistics provides cancer information about the U.S. population. Information about new cancer cases (incidence) comes from CDC’s National Program of Cancer Registries (NPCR) and NCI’s Surveillance, Epidemiology, and End Results (SEER) Program, and information about cancer deaths comes from CDC’s National Center for Health Statistics.
The latest data release includes information about new cancer cases and deaths through 2020, the first year of the COVID-19 pandemic.
In March 2020, the World Health Organization declared COVID-19 a pandemic. Soon after, stay-at-home orders, business and school shutdowns, and travel advisories were implemented in the United States to prevent the spread of COVID-19. Additionally, some health care systems reduced access to routine care. These measures, along with concern about getting COVID-19, interrupted cancer screening, diagnosis, and care as people postponed or deferred health care visits, particularly from March to May 2020.
Cancer rates normally change from year to year, in part because of changes in screening test use, diagnostic practices, and treatment. In addition, some changes in 2020 may be from disruptions in cancer care caused by the COVID-19 pandemic. Reporting of cancer cases may have been delayed from disruptions in registry operations (for example, reduced access to medical records or central cancer registry staff reassigned to COVID-19 response efforts). Changes in incidence may be apparent immediately whereas changes in death rates may take years to see. This year’s U.S. Cancer Statistics Highlights presents rates for new cancer cases and deaths occurring in 2020, with data from previous years as a comparison.
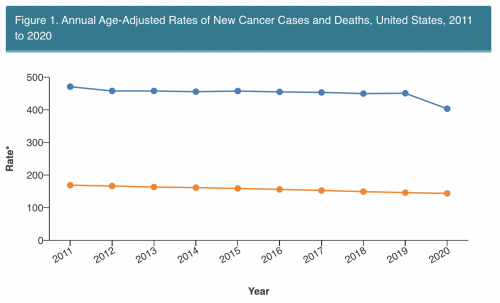
CDC United States Cancer Statistics, June 2023

CDC United States Cancer Statistics, June 2023
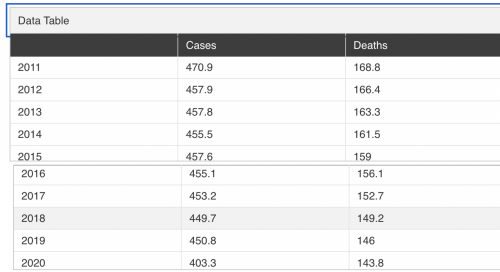
CDC United States Cancer Statistics, June 2023
In the past 10 years, cancer mortality declined steadily to 144 deaths per 100,000 standard population in 2020. In contrast, cancer incidence was relatively stable during 2011 to 2019 but dropped sharply in 2020 to 400 cases per 100,000 standard population. This drop is thought to reflect missed diagnoses, rather than a true decline in incidence.
Caution must be taken when including the 2020 incidence datapoint in trend models to avoid incorrect interpretations of the effect of cancer prevention and early detection efforts. Observed downward trends may be due largely to the lower observed incidence in 2020 resulting from missed diagnoses related to disruptions in health services and cancer reporting caused by the COVID-19 pandemic.
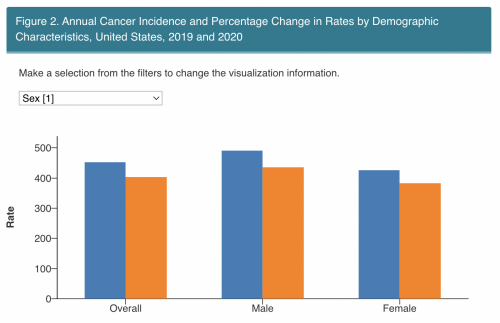
CDC United States Cancer Statistics, June 2023
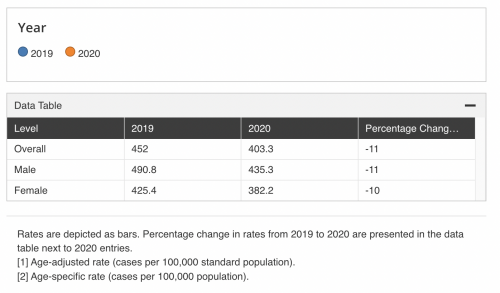
CDC United States Cancer Statistics, June 2023


CDC United States Cancer Statistics, June 2023
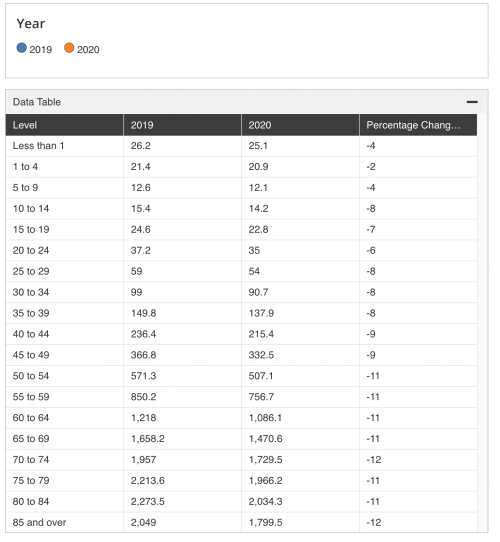
Overall, cancer incidence decreased 11% from 2019 to 2020.
- The decline in incidence was observed among both males (11% decline) and females (10% decline).
- Cancer incidence declined 11% to 13% among racial and ethnic groups.
- Cancer incidence declined among infants and children age 0 to 14 years (ranging from 2% to 8% decline), adolescents and young adults age 15 to 39 years (ranging from 6% to 8% decline), and adults 40 years and older (ranging from 9% to 12% decline).

CDC United States Cancer Statistics, June 2023

CDC United States Cancer Statistics, June 2023
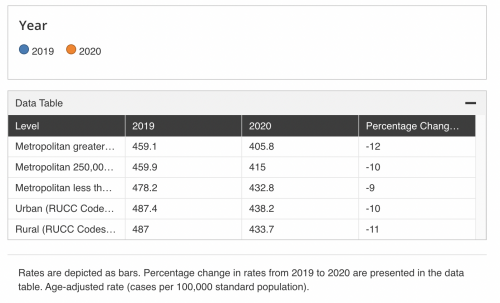
Cancer incidence differed by county-level urbanicity (as defined by the 2013 Rural-Urban Continuum Codes developed by the U.S. Department of Agriculture). Incidence declined more in metropolitan counties with population of 1 million or more (12% decline) and in rural counties (11% decline) than in other counties (9% to 10% decline).
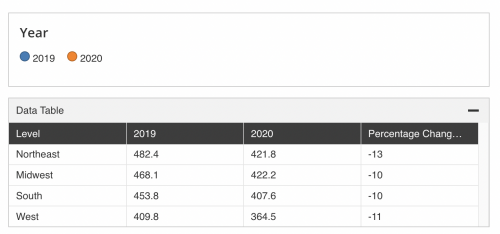
Cancer incidence differed by U.S. Census region, being lowest in the West. Cancer incidence declined 13% in the Northeast, 11% in the West, and 10% in the Midwest and the South. Because cancer incidence decreased differently in these regions, the differences between these groups shifted. For example, in 2019, the Northeast had higher cancer incidence than the Midwest; but in 2020, incidence was similar because the Northeast experienced a higher decline in rates from 2019 to 2020.
Caution must be taken in comparing 2020 cancer incidence rates between groups because some groups may have had disproportionate disruptions in health services, leading to larger delays and reductions in cancer screening and diagnosis, and disproportionate delays in reporting.

CDC United States Cancer Statistics, June 2023
CDC United States Cancer Statistics, June 2023
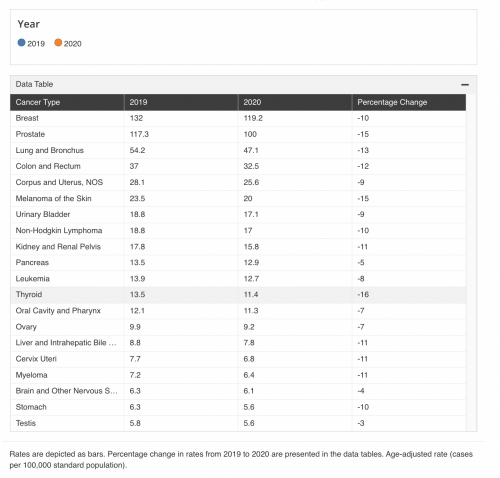
Decreases in incidence from 2019 to 2020 varied by cancer type. Incidence decreased most (16% decline) for thyroid cancer which is often found incidentally during health care visits. Incidence decreased 10% to 15% among cancer types commonly found by early detection or screening tests (breast, cervix, prostate, lung, and colon and rectum). Incidence decreased least (3% to 5%) for cancer types, such as pancreatic, testicular, and brain cancer, that are often found when patients come in with symptoms.
Explore U.S. Cancer Statistics
The Data Visualizations tool makes it easy for anyone to explore and use the latest cancer data.
You can use this tool to create interactive graphics examining—
- New cancer cases and cancer deaths by—
- State, county, and Congressional district.
- Sex, age, race, ethnicity, and year.
- Number and percentage of new cancer cases by stage at diagnosis.
- Survival statistics by stage at diagnosis (by state).
- Number of cancer survivors—also called prevalence (by state).
- Percentage of people who are up to date on colorectal, cervical, and breast cancer screening (by state and county).
- Percentage of people with selected cancer risk factors (by state and county).
Researchers can use SEER*Stat software to analyze incidence data from the entire United States with the Public Use Databases.
Data Sources
Data in this brief come from U.S. Cancer Statistics, the official federal cancer statistics. The data in this brief are limited to invasive (malignant) cancers which excludes basal and squamous cell carcinomas of the skin except when these occur on the skin of the genital organs, benign and borderline brain and central nervous system tumors, and in situ cancers except urinary bladder. Urinary bladder cancer includes invasive and in situ.
U.S. Cancer Statistics incidence data are from population-based registries that participate in CDC’s National Program of Cancer Registries (NPCR) and/or the National Cancer Institute’s Surveillance, Epidemiology, and End Results (SEER) Program and met high-quality data criteria for the 2022 data submission, covering 97% of the U.S. population (excluding data from Nevada and Indiana). U.S. Cancer Statistics death data are from CDC’s National Center for Health Statistics National Vital Statistics System and cover 100% of the U.S. population.
More Information
U.S. Cancer StatisticsCancer and COVID-19
CDC Museum COVID-19 Timeline
Effect of COVID-19 Pandemic on 2020 U.S. Cancer Statistics
Impact of COVID on 2020 SEER Cancer Incidence Data
Citation: Centers for Disease Control and Prevention. U.S. Cancer Statistics: Highlights from 2020 Mortality and Incidence with Comparison to 2019 Incidence to Assess the Effect of the COVID-19 Pandemic. USCS Data Brief, no. 35. Atlanta, GA: Centers for Disease Control and Prevention, US Department of Health and Human Services; 2023.
This data brief was published by the Centers for Disease Control and Prevention on June 8, 2023.


Comments
Comments